


Hotel Sales Analytics
Data Analytics in Hotel Group Sales
Hotels already hold plenty of sales data. The gap is turning it into decisions. This guide covers the group sales KPIs that matter, dashboards teams actually use, how to read MICE and SMERF demand, and where analytics stalls without fast execution between inquiry and proposal.



How Hotels Use Data Analytics to Win More Group Sales
Data analytics in hotel sales means using booking history, pipeline activity, and market signals to decide which segments to pursue, how fast to respond, and where to set rates. For group sales teams, the practical question is narrower: which numbers actually predict closed business, and how quickly can the team act on them?
This article covers the metrics that matter, how to build dashboards that drive daily decisions, how to read MICE and SMERF demand, and where analytics stops being useful because nobody has the time to act on it.
Why data analytics matters for hotel sales teams
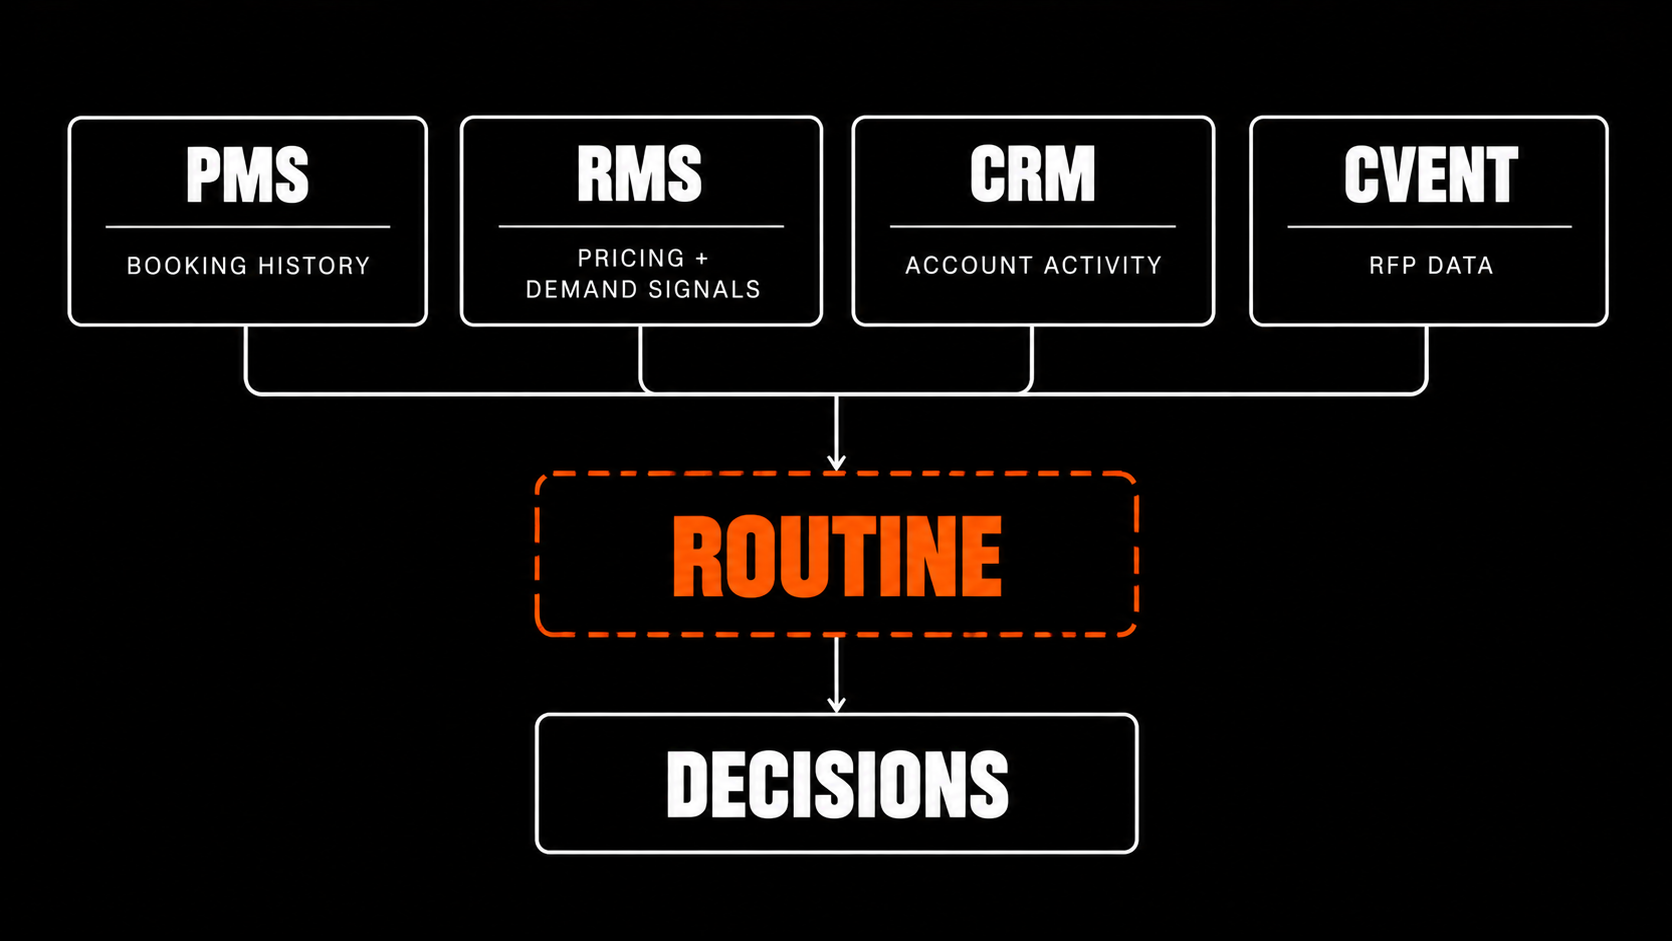
Most full-service hotels already generate more data than their sales teams use. The PMS holds booking history, the RMS holds pricing and demand signals, the CRM holds account activity, and event systems such as Cvent hold RFP data. The gap is rarely a lack of data. It is the lack of a routine that turns it into decisions.
Analytics helps a group sales team in four concrete ways:
- Forecasting demand. Historical pickup and pacing data show when demand typically builds, which supports pricing, inventory control, and outreach timing.
- Targeting effort. Segment-level revenue and win rates show where selling time earns the most return.
- Finding stalled deals. Response-time and engagement data show where opportunities cool before a contract is signed.
- Shaping offers. Patterns in what past groups bought point to packages that can be proposed up front.
The money impact is real. Industry forecasts say better use of data can lift a hotel's revenue per available room (RevPAR) by a few percent. That sounds small, but a full-service hotel books large groups, so even a few percent adds up fast.
Although, you should treat any forecast as a rough guide. Before you start, measure your own current numbers so you can see what really changes.
Which KPIs should hotels track for group sales growth?
The core group sales KPIs are inquiry-to-booking conversion rate, response time, lead time and peak booking periods, cost of winning business by channel, and revenue per booking by segment. A dashboard becomes a decision tool when each of these is broken down rather than reported as one blended number.
Conversion rate
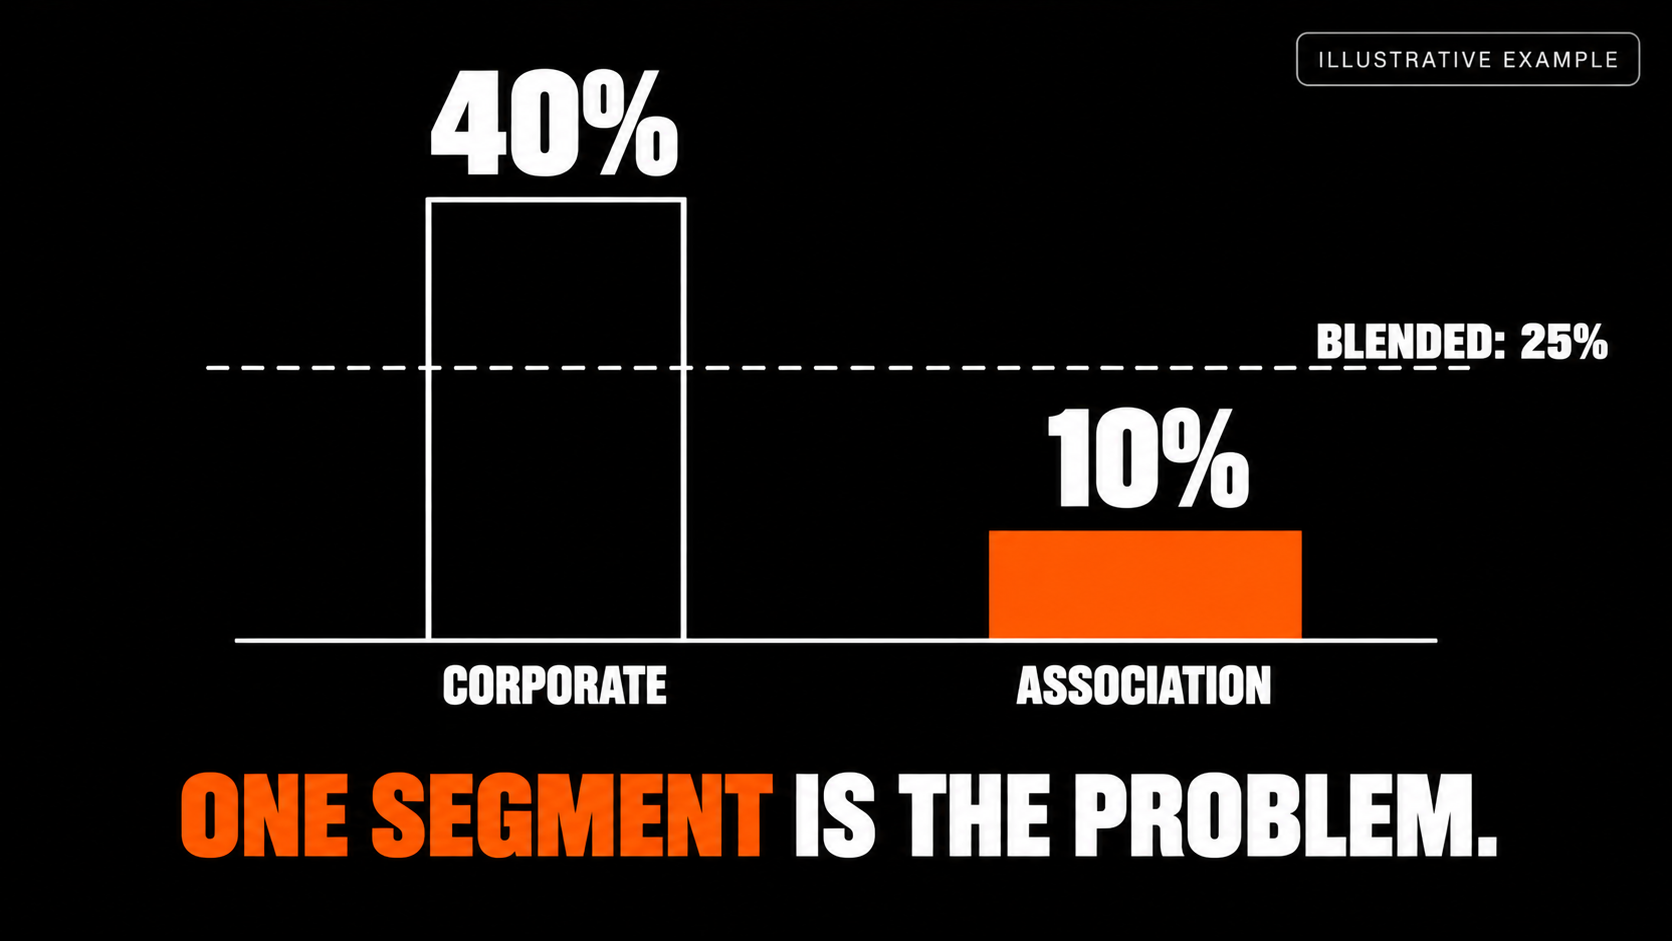
Conversion rate shows what share of inquiries become contracted business. The blended figure hides more than it reveals. Split it by segment, event type, inquiry source, and seller. A team converting 25% overall might convert 40% of corporate meetings and 10% of association business, which points to a proposal problem in one segment rather than a team-wide problem.
Response time
Speed is a revenue variable in group sales. Planners often send the same RFP to many properties, and they build shortlists from the responses that arrive while they are still evaluating. Industry-wide roughly 36% of RFPs going unanswered, which means a prompt, complete reply puts a property ahead of a meaningful share of the competition before pricing is even compared.
Track average first-response time, but also track where the delay sits. Common bottlenecks include collecting event details, checking availability across systems, assembling the proposal, and waiting on internal approval. Each has a different fix.
Also read: How fast hotels should reply to an RFP?
Booking windows and peak periods
Booking curve analysis shows how far ahead each segment books and when demand tends to build. That supports two decisions: when to start proactive outreach for shoulder periods, and when to hold rate rather than discount reactively.
Cost of acquisition by channel
Compare what it costs, in sales time and marketing spend, to win business from each RFP source and outreach channel. If one channel consistently produces larger, repeatable bookings at lower cost, budget and seller attention should follow it.
Revenue per booking by segment
Total room nights hide mix. Look at the full value of each booking, including meeting space, food and beverage, and ancillary spend, by segment. A segment with fewer bookings but higher total value may deserve more of the team's time.
How do you set up a hotel sales dashboard that people actually use?
A useful sales dashboard shows live pipeline and response data, compares sellers and segments, and surfaces trends early enough to act on. It should answer three daily questions: what needs attention today, what is changing, and where is revenue at risk.
Live pipeline and response metrics. Show open inquiries, time since first response, proposals outstanding, and revenue by segment. Managers should see stalled deals this week, not in a month-end report.
Seller-level performance. Side-by-side conversion and response data make coaching objective. If one seller converts a segment well above the team average, study their proposals, timing, and follow-up pattern and share what works.
Trend detection. Aggregate numbers hide shifts. An increase in corporate inquiries from one region, a change in event-type mix, or a slow seasonal drift only becomes visible when data is cut by segment and period.
Two design rules keep dashboards from becoming shelfware. First, every metric should have an owner and a threshold that triggers action. Second, the dashboard should connect activity metrics, such as response time and follow-ups, to revenue outcomes, so the link between behavior and results stays visible.
Using analytics to identify MICE and SMERF trends
MICE (meetings, incentives, conferences, and exhibitions) and SMERF (social, military, educational, religious, and fraternal) groups are major sources of group revenue, and they behave differently. Research firms project strong long-term growth for the global MICE market, though the specific figures vary by publisher and methodology, so a property's own pacing and pickup data are a better guide to local demand than any global forecast.
Segment your accounts by behavior, not just label
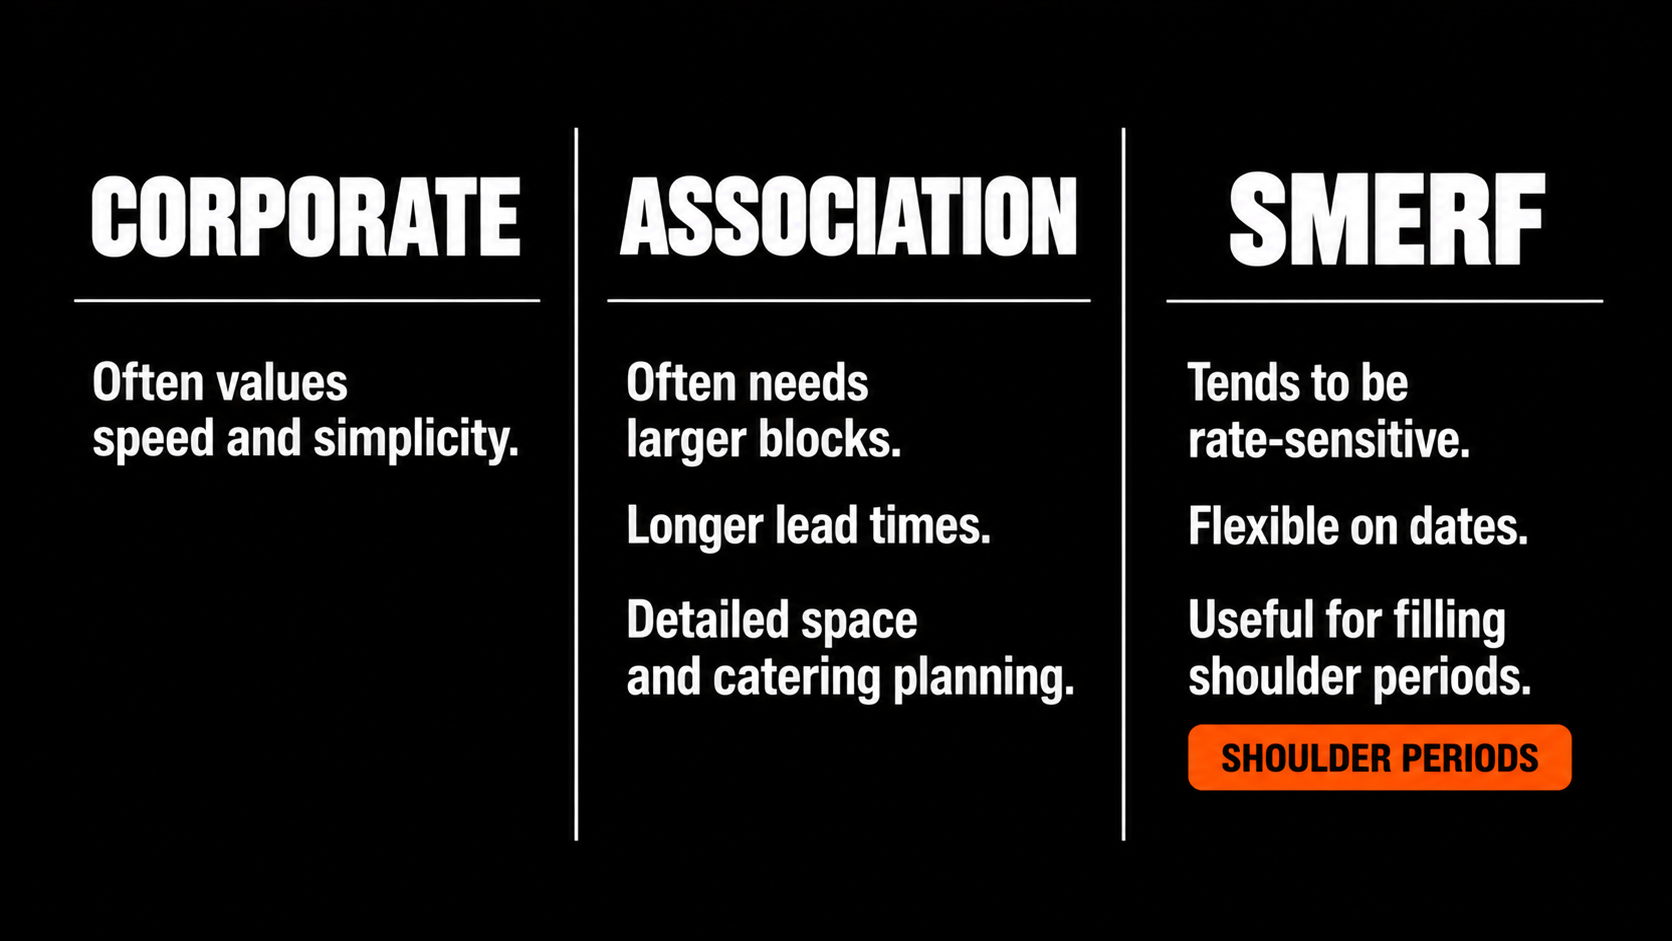
Classify groups by sector, event type, booking frequency, lead time, budget, and ancillary spend. A corporate meeting planner and an association conference organizer want different things: the first often values speed and simplicity, the second often needs larger blocks, longer lead times, and detailed space and catering planning. SMERF groups tend to be more rate-sensitive and flexible on dates, which can make them useful for filling shoulder periods.
Forecast with pickup and pacing
Compare current group pace against the same point in prior years. Pace behind history for a given segment is an early warning, and it gives the team time to start targeted outreach rather than discount at the last minute.
Benchmark competitors with specifics
If a competing property keeps winning conference business you lose, study what is observable: response speed, proposal format, package structure, and rate positioning. The goal is a testable hypothesis about why you lose, not speculation.
How analytics improves marketing and sales ROI
Analytics pays off when it changes what the team does. Four areas tend to produce the clearest returns.
RFP strategy. Look at which RFP sources produce the most closed business and which response patterns, such as timing, personalization, and completeness, correlate with wins. For properties handling meaningful RFP volume, the next step is execution: if the data shows that fast responses win, the process has to produce fast responses consistently, from every channel.
Targeted campaigns. If corporate groups deliver higher deal size and repeat rate, concentrate outreach there and measure the result, instead of spreading effort evenly.
Packages built from real behavior. If booking data shows that wedding groups often add spa services, or that association conferences regularly need a pre-conference dinner buyout, include those in the first proposal. Proposing what groups tend to buy shortens negotiation.
Pricing discipline. Review win rates at different price points by event type and demand period. Hold rate where demand supports it and flex where history shows it is needed. Avoid reacting to month-end pressure.
Also read: Hotel group revenue management.
How do you build a data-driven culture in a hotel sales team?
A data-driven sales team treats analytics as part of the weekly operating rhythm, not a quarterly exercise. Three habits matter most.
Train for application. Sellers need to know how to read a conversion report, act on a response-time analysis, and spot which pipeline deals are cooling. Training that stops at tool navigation does not change behavior.
Reduce the manual work between data and insight. If analysts or sellers spend hours compiling reports from separate systems, the insight arrives too late. Business intelligence tools, CRM analytics, and automation shorten that gap.
Review on a fixed cadence. Weekly reviews for operational metrics such as response time and open proposals, and quarterly reviews for strategic patterns such as segment mix and channel cost. Each review should end with a decision and an owner. Teams that close the loop, so that findings change actions and the changed actions are measured, improve steadily.
Where analytics falls short without execution
Analytics diagnoses. It does not respond to an inquiry, build a proposal, or follow up with a planner. This is the point where many sales analytics programs stall: the team can see that response time is costing deals, but the process that creates the delay is still manual.
The time cost is significant. Roughly 71% of seller time goes on non-selling tasks and roughly $500K in annual revenue leakage per salesperson, and those are the numbers the analytics routine is trying to change. A dashboard that reports slow proposals does nothing about them unless the proposal workflow itself gets faster.
For a team evaluating tools, a practical checklist of capabilities follows from the problem:
- Capture inquiries from every channel, including email, RFP platforms, and the website, so none go unanswered.
- Build proposals from live availability and pricing rather than rekeyed data.
- Track planner engagement so follow-up happens when interest is highest.
- Read from the systems of record already in use, so no one maintains the data twice.
- Report outcomes in terms the sales team already tracks: response time, conversion, and revenue.
Turning insight into closed revenue
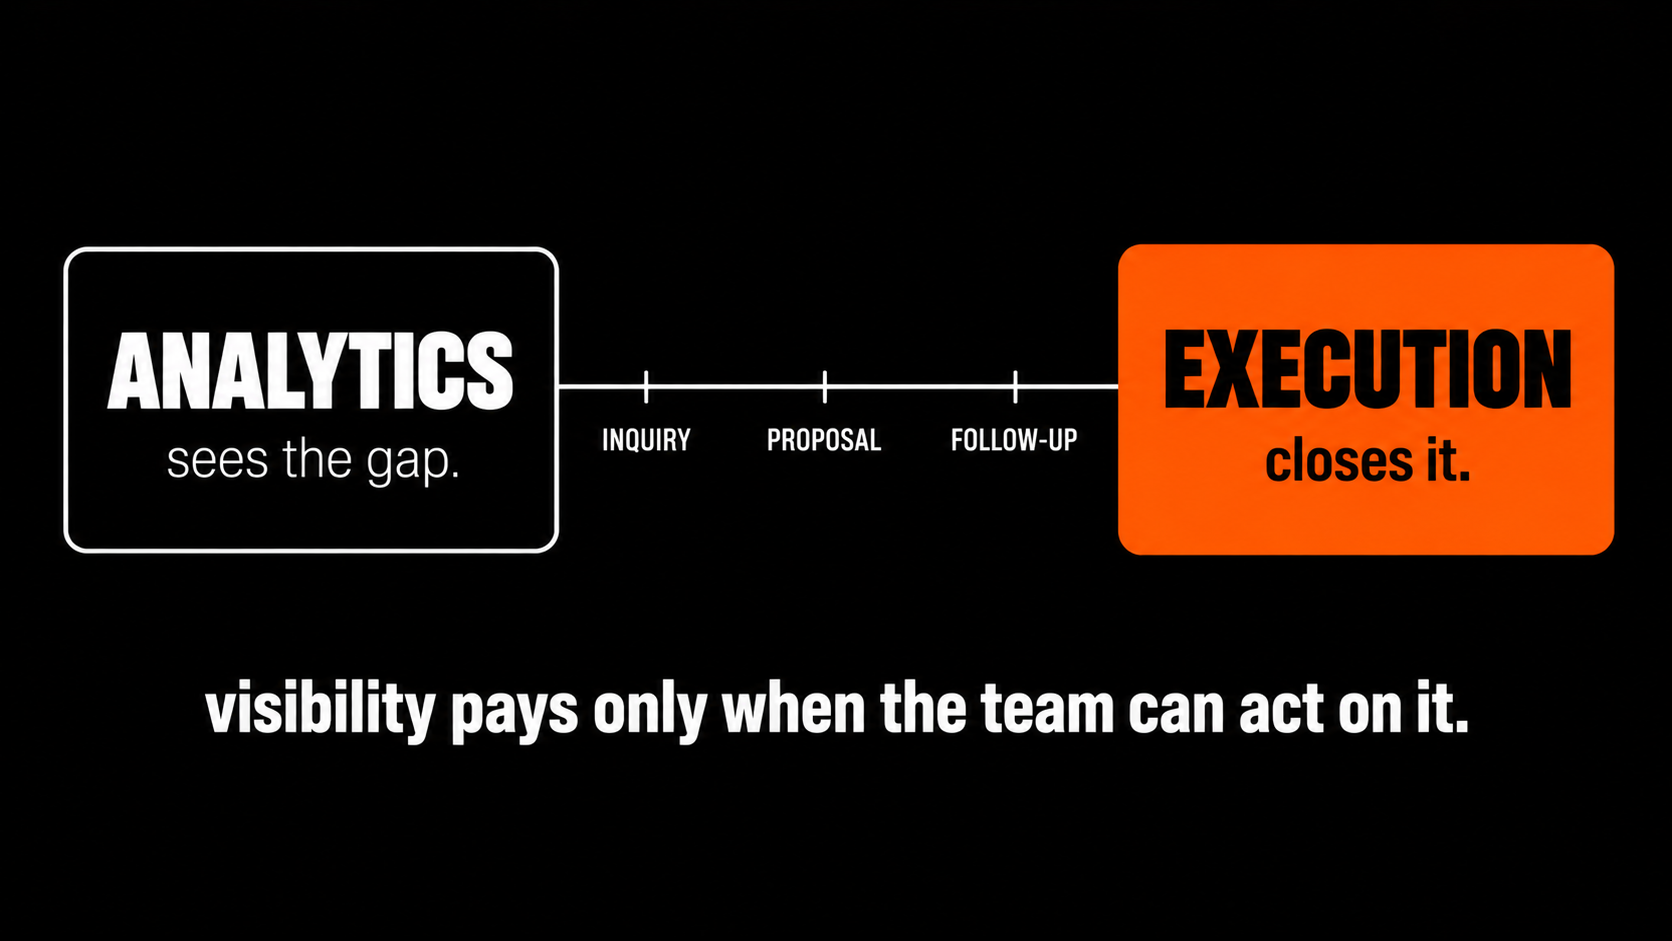
Data analytics shows a hotel sales team where it stands: which segments perform, where deals stall, and what slow responses cost. That visibility only produces revenue if the team can act on it at the speed planners expect, which means the work between inquiry and proposal has to be fast, consistent, and tracked.
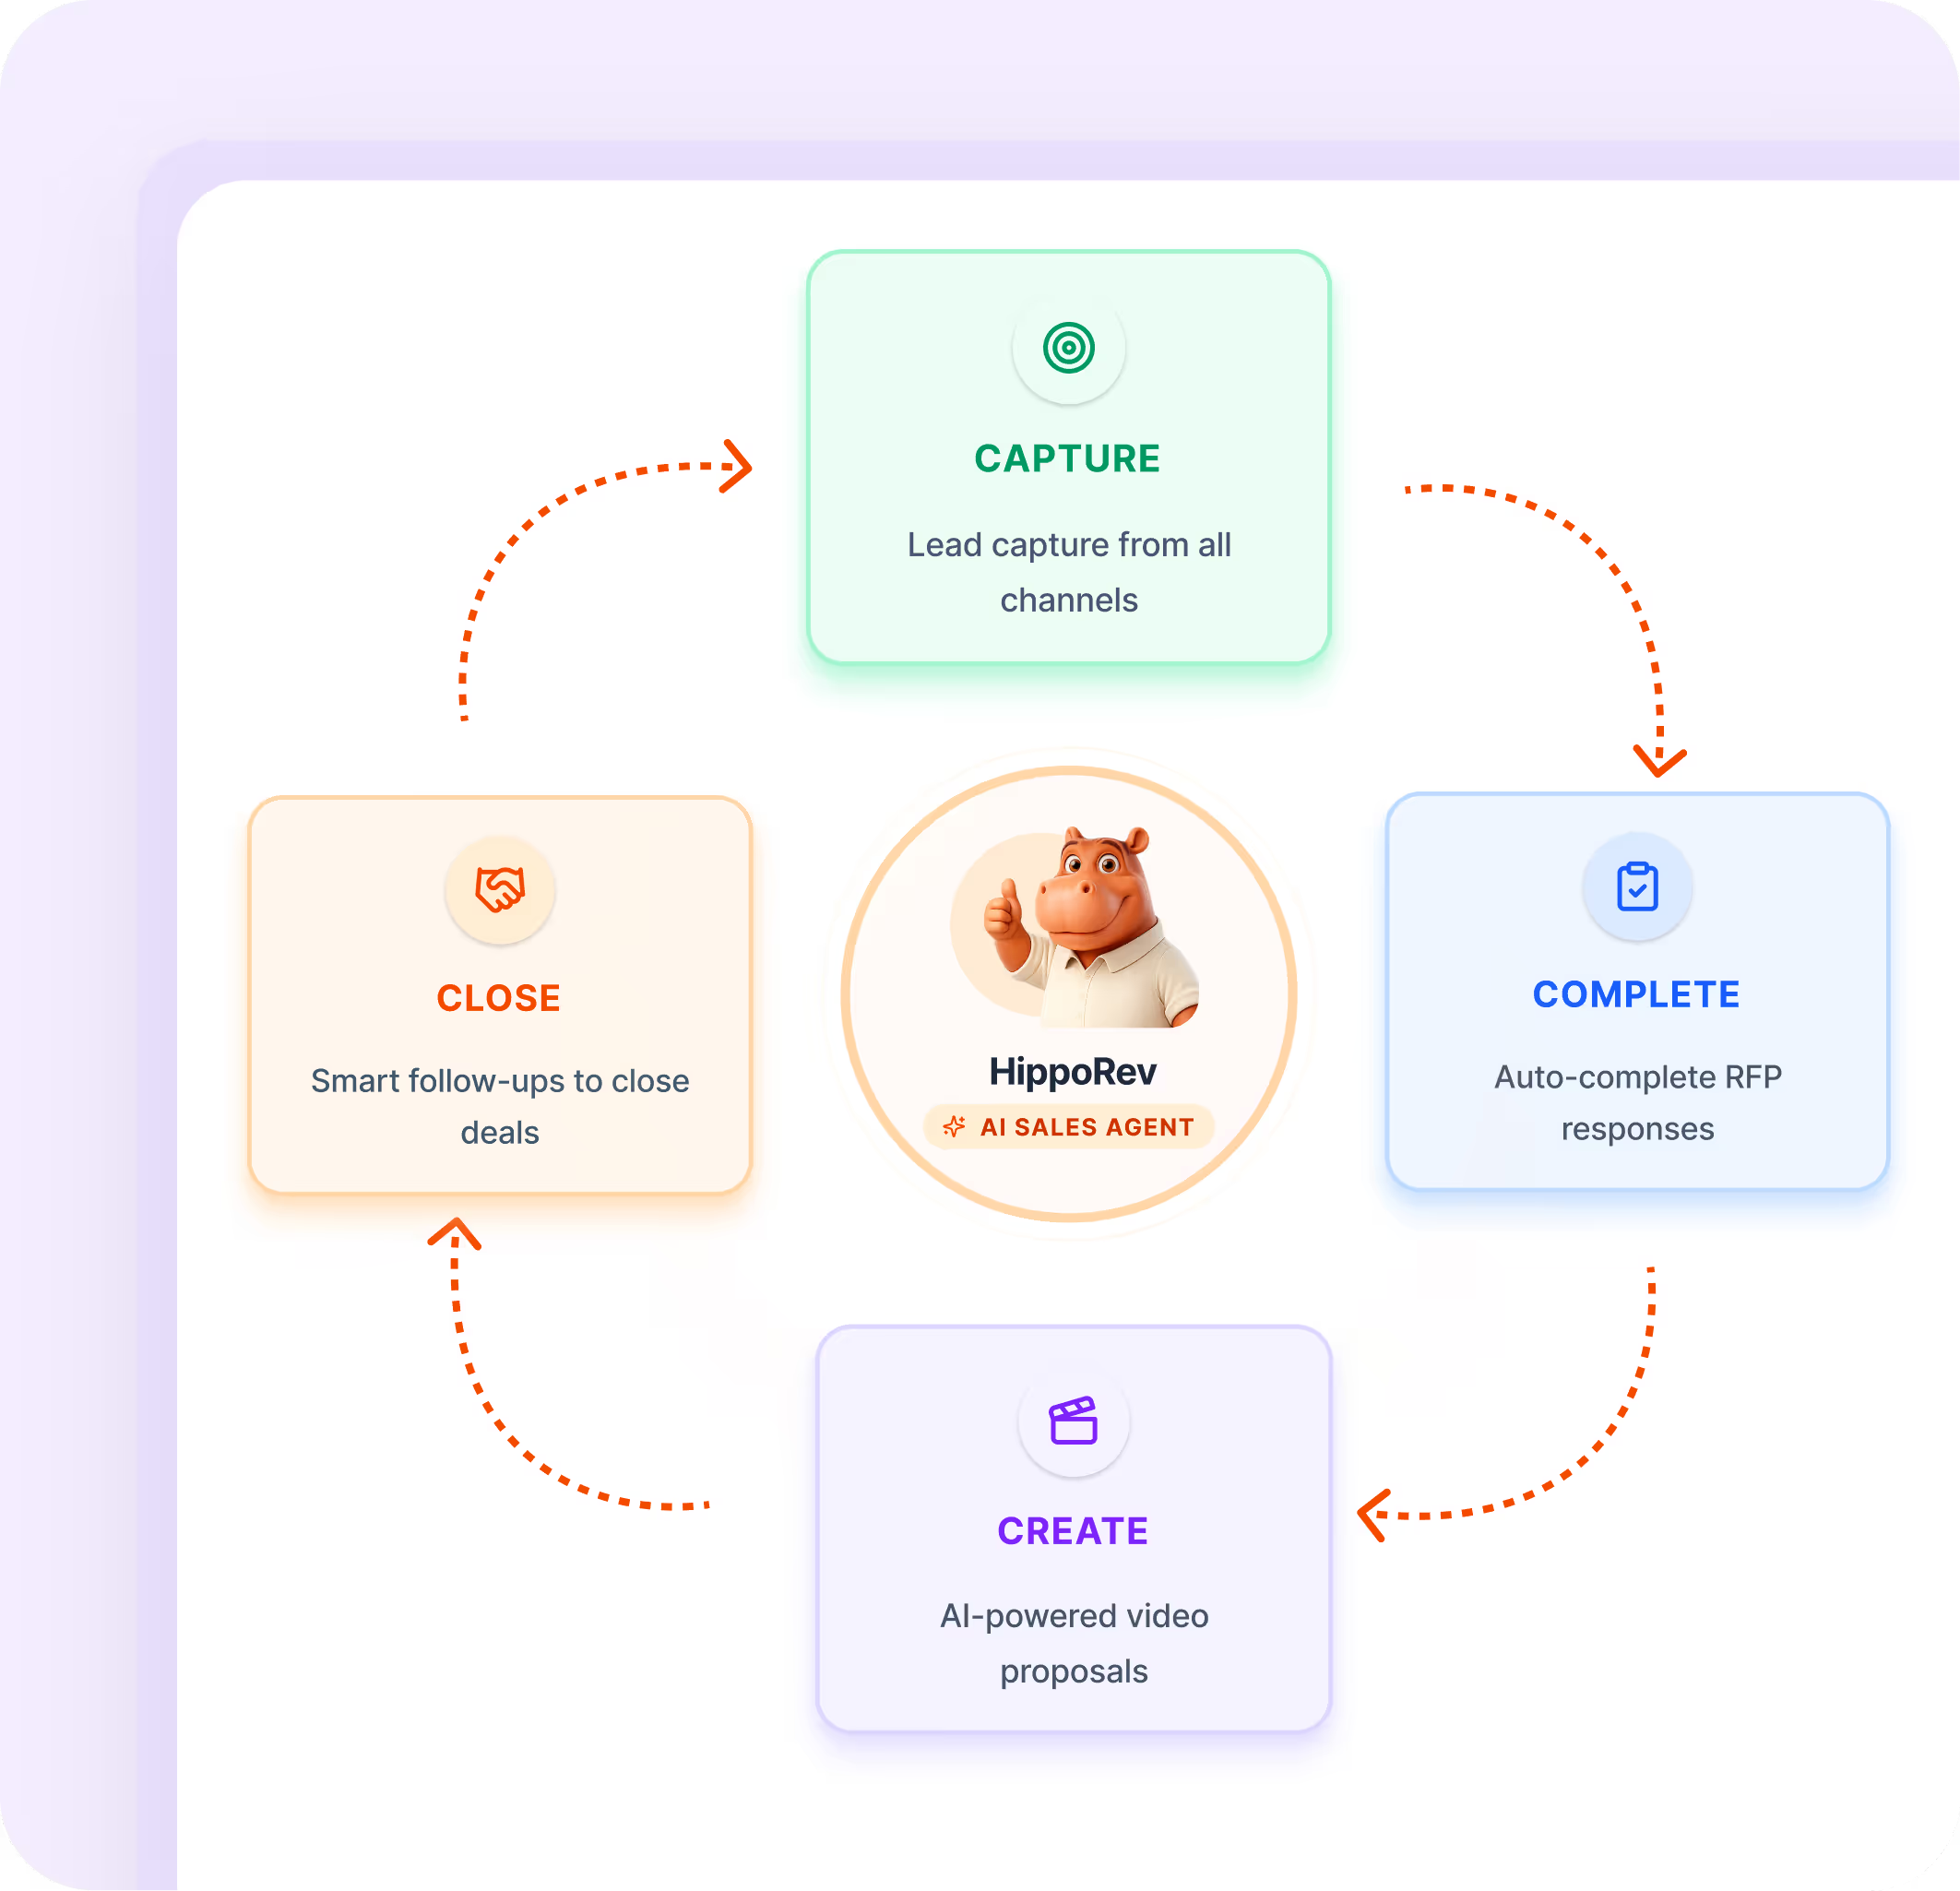
If your dashboards show a gap between what your pipeline could produce and what it does, Hippo Rev, a Revenue Capture Platform for hotel group sales, is built to close it. It reads from the systems your data already lives in, such as your PMS, RMS, CRM, and Cvent, and runs the deal motion across Capture, Convert, and Grow, so seller time goes back to selling. You can see how it works by booking a Capture Audit here.
Frequently Asked Questions
How can data-driven decision-making improve hotel group sales?
Analyzing booking trends, customer behavior, and conversion patterns lets teams make targeted decisions on pricing, outreach, and proposals. The gains come from better resource allocation and faster, more relevant responses.
What metrics should hotels track to improve group sales?
Track conversion rate, response time, peak booking periods, cost of acquisition by channel, and revenue per booking by segment. Together they show where the sales process works and where revenue is being lost.
What are the advantages of a sales performance dashboard?
It makes tracking continuous, so managers can spot trends and performance gaps and decide using current data. The best dashboards link daily activity to revenue outcomes.
How can hotels use analytics to improve marketing?
By identifying which segments yield the highest revenue per booking, which channels convert best, and which offers drive repeat business, hotels can move spend toward what performs.
Share this post
Ready to close more group business?
See how HippoRev can transform your hotel sales workflow in 15 minutes.
Follow us


