


Hotel Sales Analytics
Hotel CRM Metrics: KPIs That Drive Sales and Revenue
Hotel CRM metrics help sales teams understand how customer engagement turns into proposals, bookings, repeat business, and revenue. The blog explains the most useful engagement, conversion, retention, and revenue KPIs while showing how dashboards and workflow analysis can reveal where opportunities are being lost.



Hotel CRM Metrics That Matter: How to Measure Engagement, Conversion, and Group Booking Revenue
A hotel can generate hundreds of inquiries, send dozens of proposals, and record plenty of sales activity without winning more business.
That is the problem with measuring hotel sales performance through activity alone.
Hotel CRM metrics help connect customer interactions to commercial outcomes. They show where inquiries originate, how efficiently sales teams respond, which opportunities become confirmed bookings, and whether those relationships generate repeat revenue.
For hotels managing corporate accounts, group bookings, and meetings and events, this matters particularly. A single inquiry may involve multiple decision-makers, negotiated room blocks, catering requirements, and several rounds of proposals.
The challenge is identifying which activities contribute to revenue and which simply keep the sales team busy.
What Are Hotel CRM Metrics?
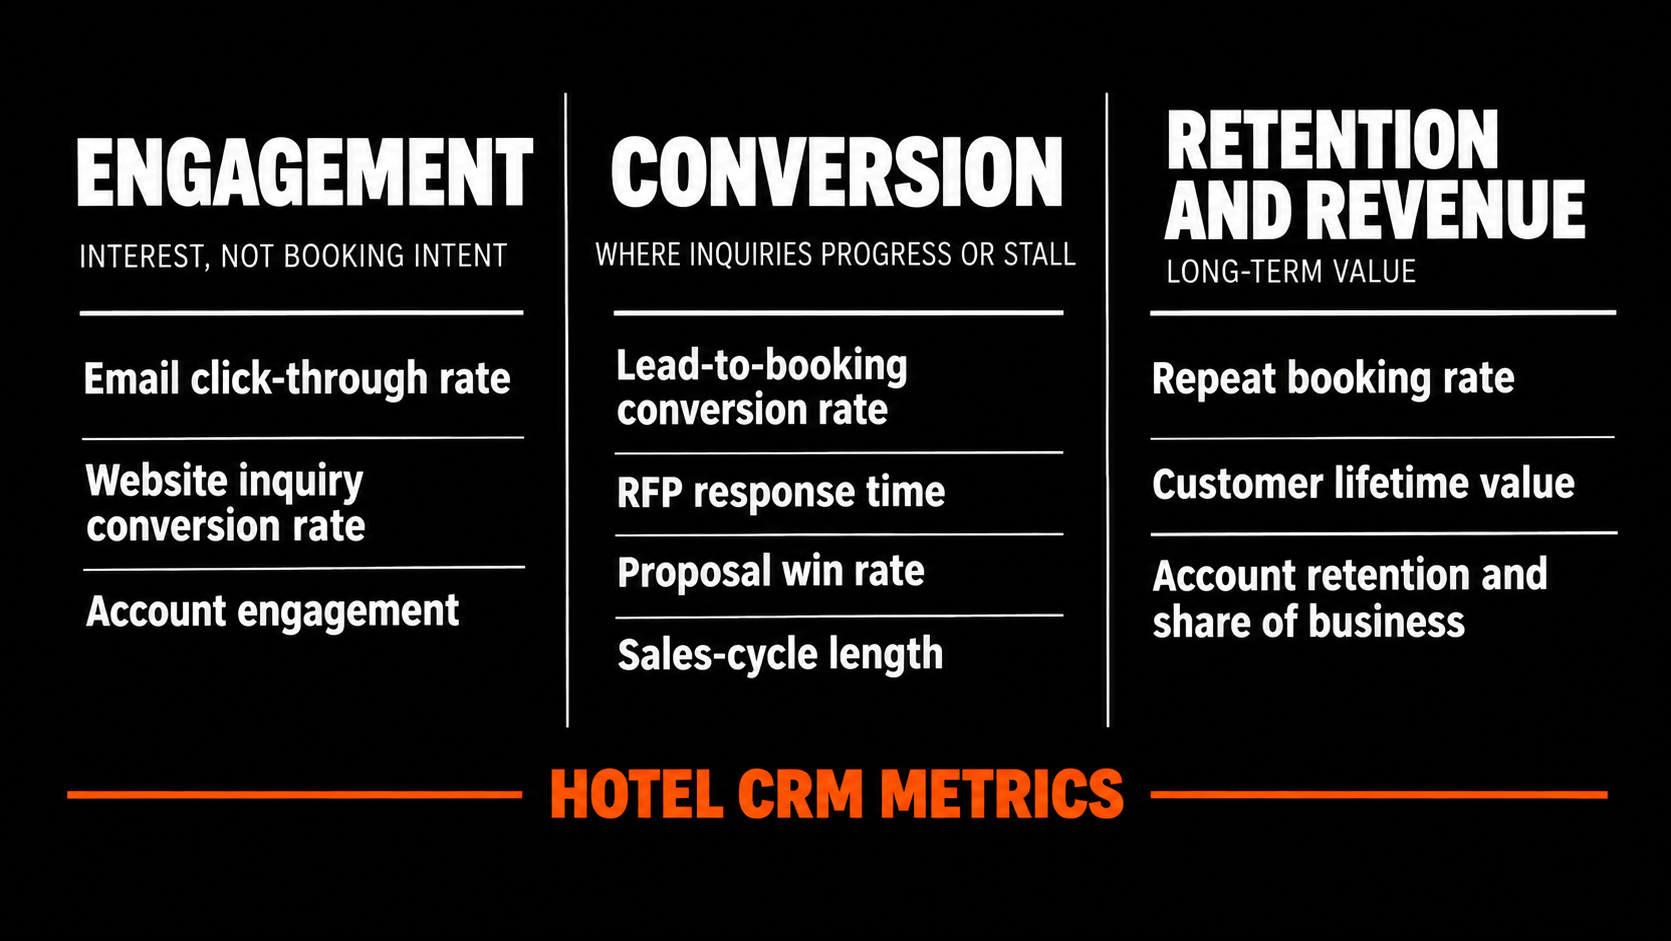
Hotel CRM metrics measure how effectively a hotel attracts, manages, converts, and retains customers through its customer relationship management processes.
They generally fall into three categories:
- Engagement metrics: Measure customer interest through email interactions, website inquiries, and account activity.
- Conversion metrics: Track how effectively inquiries progress into proposals and confirmed bookings.
- Retention and revenue metrics: Evaluate repeat bookings, account value, and long-term commercial performance.
These measurements are most useful when considered together.
For example, a campaign generating 40 qualified group inquiries may produce more revenue than one attracting 200 poorly matched leads. Similarly, faster proposal delivery means little if the proposals fail to meet planners' requirements.
1. Engagement Metrics: Measuring Customer Interest
Engagement metrics indicate whether a hotel's communications are attracting attention from potential customers.
However, engagement does not necessarily indicate booking intent.
Email Click-Through Rate
Email click-through rate (CTR) measures the percentage of delivered emails that generate recorded clicks, based on the reporting definition used.
Formula:
Email CTR = (Recorded clicks ÷ Delivered emails) × 100
If a hotel delivers 2,000 emails and records 80 clicks, its CTR is 4%.
For corporate sales teams, the context behind those clicks matters. A meeting planner exploring event capacity information may represent a more relevant opportunity than someone browsing seasonal leisure offers.
Email open rates can provide additional information, but privacy features such as Apple's Mail Privacy Protection make them less reliable indicators of actual readership.
Hotels should prioritize meaningful interactions such as replies, meeting requests, and qualified inquiries.
Website Inquiry Conversion Rate
Website inquiry conversion rate measures how frequently website visitors or sessions generate inquiries.
A hotel might attract substantial traffic to its meetings and events pages but receive relatively few RFP submissions.
Possible explanations include irrelevant traffic, missing venue information, or complicated inquiry forms.
Tracking conversion by traffic source, landing page, property, and inquiry type helps identify where improvements are needed.
Account Engagement
Corporate relationships often involve several contacts within one organization, including procurement managers, travel managers, and event planners.
Account-level engagement brings these interactions together.
It helps sales teams distinguish between an individual showing interest and an organization developing a genuine business opportunity.
2. Conversion Metrics: Turning Inquiries Into Bookings
Conversion metrics reveal what happens after a potential customer expresses interest.
For hotel sales leaders, this is where CRM reporting becomes particularly valuable.
Lead-to-Booking Conversion Rate
This metric measures the percentage of inquiries that become confirmed bookings.
Formula:
Lead-to-Booking Conversion Rate = (Confirmed bookings ÷ Total inquiries) × 100
Suppose a hotel receives 150 group inquiries during a quarter and confirms 30 bookings.
Its conversion rate is 20%.
However, not all inquiries carry the same probability of conversion.
An existing corporate client requesting meeting space differs considerably from an unsolicited RFP distributed to 20 competing properties.
Segmenting conversion rates by lead source, event type, property, and account category provides a more accurate performance assessment.
RFP Response Time
RFP response time measures how long a hotel takes to respond to a request for proposal.
Group sales responses often require room availability, meeting space specifications, catering information, negotiated rates, and property policies.
Hotels should distinguish between:
- Time to first meaningful response: How quickly the sales team acknowledges and addresses an inquiry.
- Time to complete proposal: How long it takes to deliver a proposal containing the required information.
A hotel might acknowledge an RFP within an hour but take two days to prepare the proposal.
Both measurements matter.
Track median response times and the percentage of inquiries handled within agreed service-level targets.
Speed is important, but a fast proposal containing inaccurate information can create additional work rather than improve the planner's experience.
Proposal Win Rate
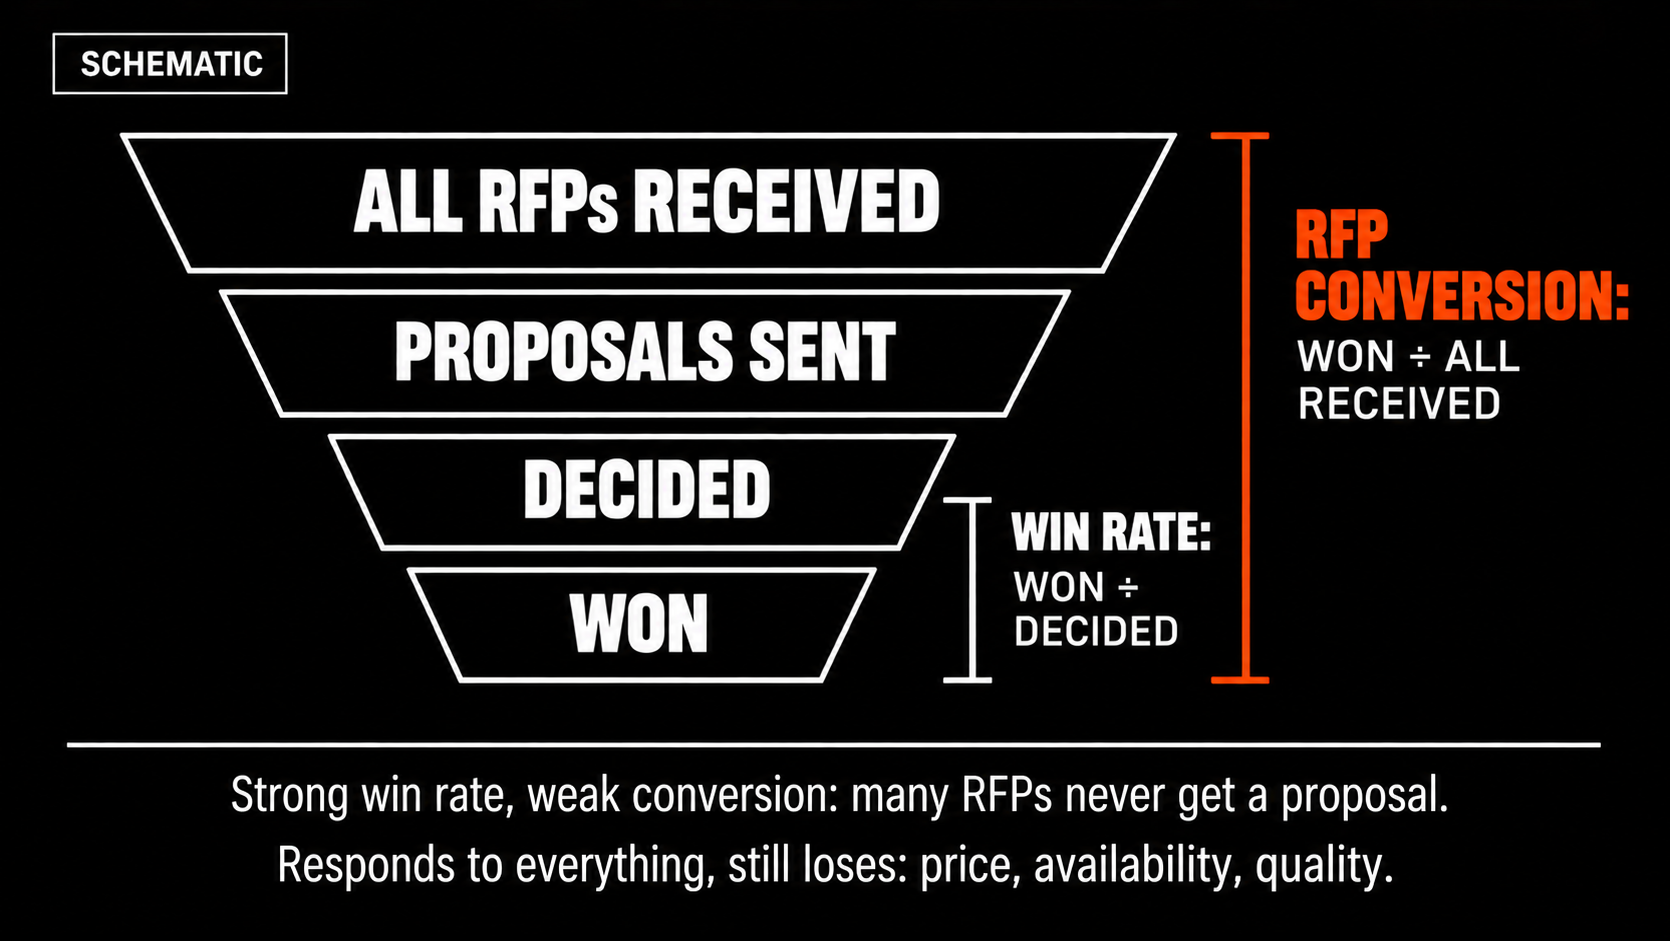
Proposal win rate measures how frequently proposals that reach a decision result in confirmed business.
Formula:
Proposal Win Rate = (Won proposals ÷ Decided proposals) × 100
This differs from overall RFP conversion rate, which compares definite bookings with all received RFPs.
A hotel might have a strong proposal win rate but poor overall RFP conversion because many inquiries never receive proposals.
Conversely, it might respond to almost every inquiry but lose business because of pricing, availability, or proposal quality.
Tracking both metrics helps identify the actual problem.
Sales-Cycle Length
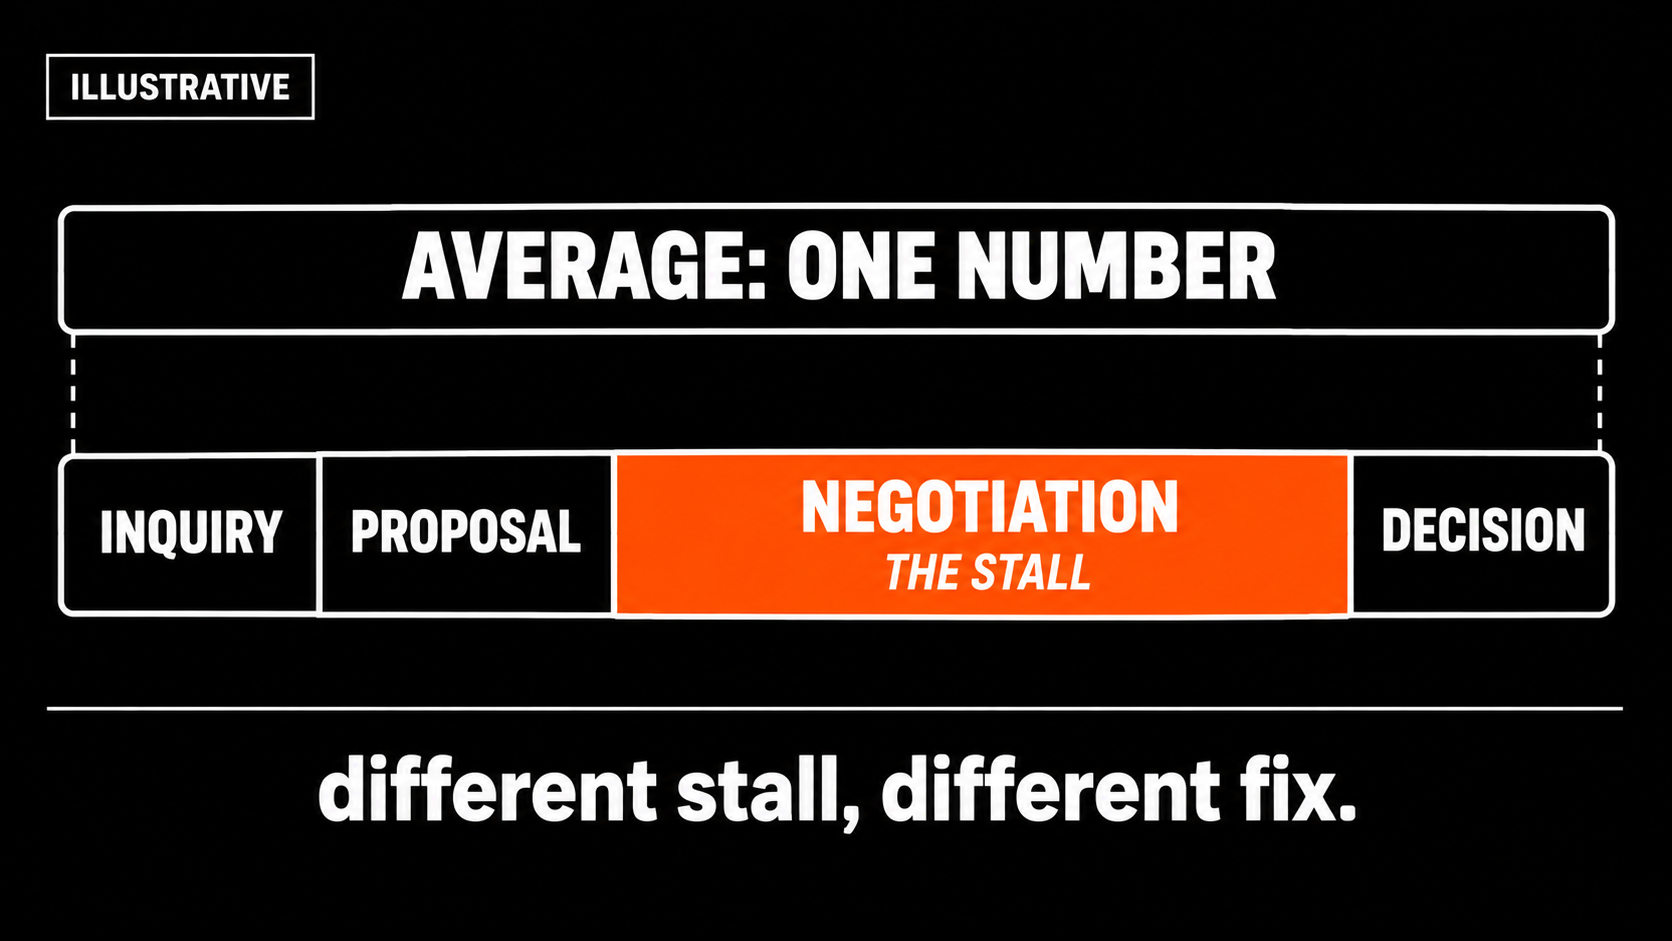
Sales-cycle length measures the time between a defined opportunity starting point and the booking decision.
For group business, this process can involve several approval stages.
Rather than relying exclusively on an average sales-cycle duration, hotels should examine time spent at individual stages.
For example, an opportunity might move quickly from inquiry to proposal but remain in negotiation for weeks.
That requires a different intervention from a proposal preparation bottleneck.
3. Retention Metrics: Measuring Long-Term Account Value
A confirmed booking represents one transaction. The relationship behind it may generate revenue for years.
Retention metrics help hotels understand that longer-term opportunity.
Repeat Booking Rate
Repeat booking rate measures the percentage of customers or accounts that book again within a defined period.
For corporate accounts, hotels might track how many organizations that booked last year return within the following 12 months.
The metric can also identify previously valuable accounts that have stopped booking.
However, booking frequency varies naturally. An annual conference organizer should not be evaluated against the same expectations as an account arranging monthly meetings.
Customer Lifetime Value
Customer lifetime value (CLV) estimates the economic value of a customer relationship over time.
A basic revenue model considers booking value, booking frequency, and relationship duration.
Consider two corporate accounts:
- Account A books one event worth $40,000.
- Account B books four events annually, each worth $15,000, for three years.
Account B generates $180,000 over that period.
However, higher revenue does not automatically mean greater profitability. Discounts, commissions, servicing expenses, and account management costs must also be considered.
CLV helps hotels evaluate relationships beyond the value of the latest booking.
Account Retention and Share of Business
An account can remain active while gradually directing more business toward competing properties.
This makes account retention and share of business distinct measurements.
Retention indicates whether the relationship continues. Share of business estimates how much of the account's relevant spending the hotel captures.
Monitoring booking frequency, account revenue, and lost opportunities can reveal weakening relationships before they disappear entirely.
4. Hotel CRM Metrics That Connect Sales to Revenue
CRM reporting becomes more useful when engagement and conversion data are connected to financial performance.
A practical hotel sales scorecard should include:
Hotels should also monitor average daily rate (ADR), occupancy, and revenue per available room (RevPAR).
However, these revenue management metrics serve different purposes.
RevPAR measures room revenue relative to available inventory. It does not explain whether the group sales team responded efficiently or converted qualified inquiries.
For example, a hotel's RFP conversion rate might remain unchanged while average booking value declines.
The team is still converting opportunities, but each booking generates less revenue.
This illustrates why booking volume, conversion rate, and booking value should be evaluated together.
5. Building a Hotel CRM Dashboard That Supports Decisions
A useful CRM dashboard should help managers identify problems and determine what action to take.
Start with consistent definitions.
Every property should understand what constitutes a qualified inquiry, when an RFP is received, when a proposal is sent, and when an opportunity becomes definite.
Next, organize reporting around the sales funnel.
Marketing teams can evaluate lead sources and inquiry quality. Sales managers can monitor response times, proposals, and pipeline progression. Revenue leaders can assess booking values and account contributions.
Dashboards should also distinguish between leading and lagging indicators.
Overdue follow-ups and response delays are problems managers can address immediately. Confirmed revenue and repeat bookings reveal the results of earlier activity.
Segment Performance
Property-wide averages can conceal important differences.
A convention hotel preparing complex event proposals operates differently from a limited-service property handling straightforward room blocks.
At minimum, segment CRM reporting by property, business type, lead source, and booking value.
This makes comparisons more meaningful and helps identify whether bottlenecks are local or widespread.
Examine the Workflow Behind the Numbers
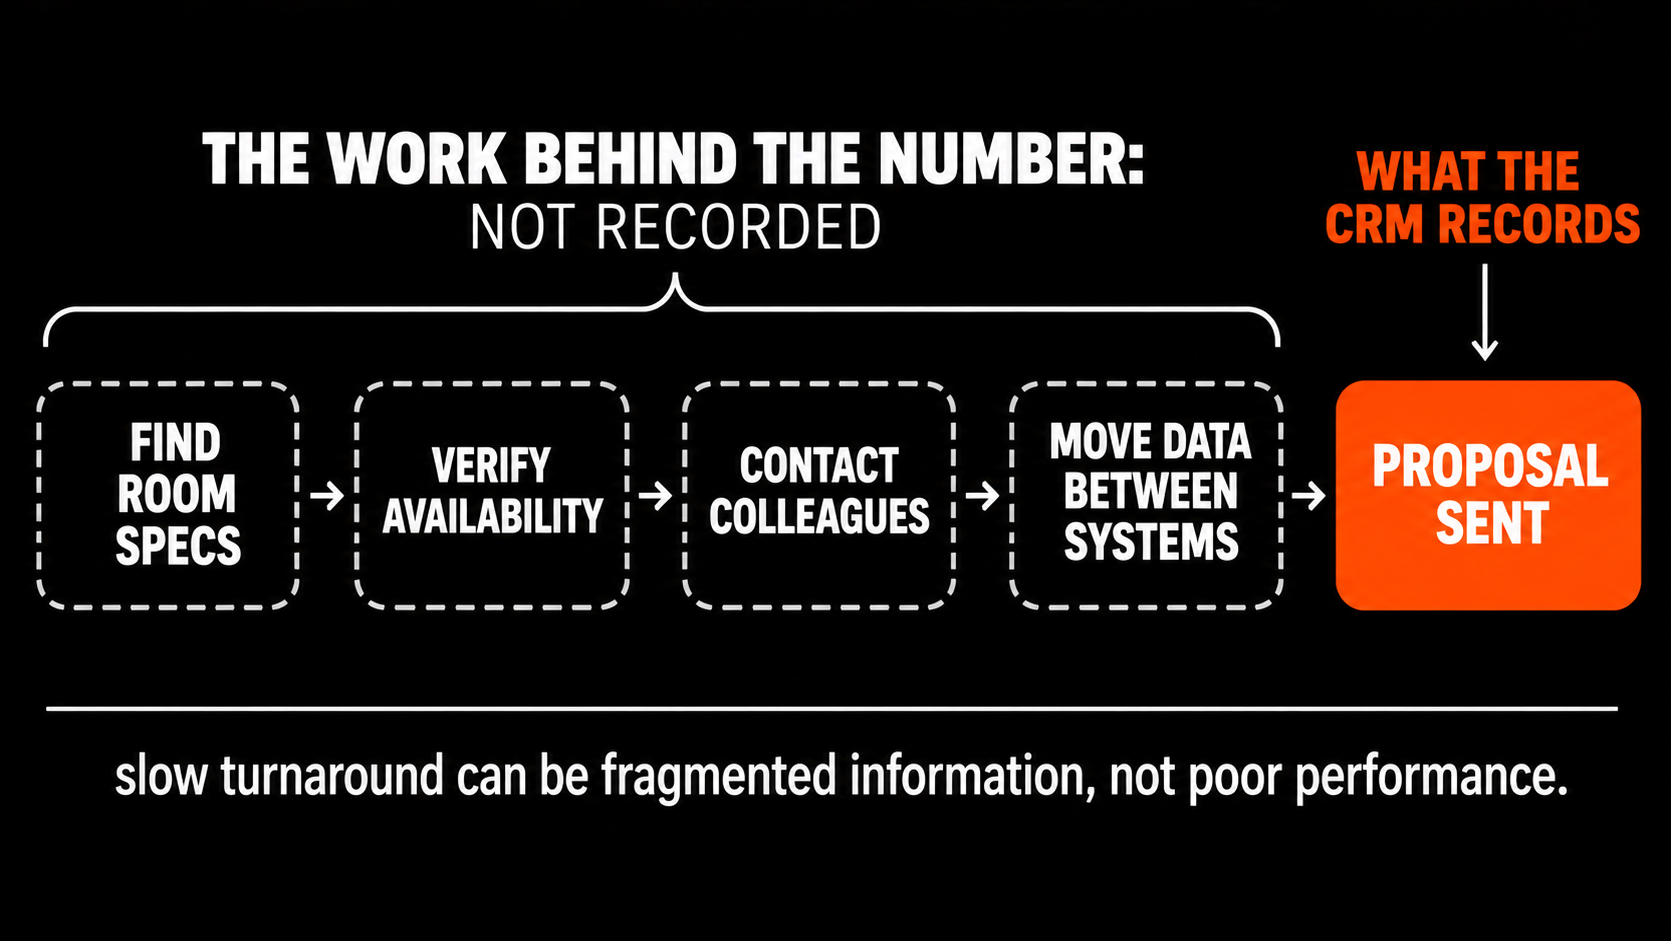
A CRM may record when a proposal was sent without showing how much work went into preparing it.
A salesperson might spend considerable time finding room specifications, verifying availability, contacting colleagues, and transferring information between systems.
If response times are slow, the underlying problem may be fragmented information or repetitive administration rather than poor salesperson performance.
Understanding the workflow is essential before deciding how to improve it.
6. How CRM Automation Can Improve Hotel Sales Performance
CRM automation can reduce administrative work, improve process consistency, and help teams maintain timely follow-ups.
Different automation capabilities address different problems.
Automated lead assignment can reduce routing delays. Follow-up reminders help prevent unattended opportunities. Proposal templates reduce repetitive preparation.
More advanced workflows can assist with extracting RFP requirements and preparing draft responses.
However, marketing automation, CRM functionality, and group sales proposal automation are not interchangeable.
A system designed for promotional email campaigns may do little to reduce the time required to prepare a complex event proposal.
Hotels should evaluate automation against specific operational bottlenecks.
Before implementing a solution, establish baseline measurements for proposal preparation time, administrative workload, response consistency, and completion rates.
After implementation, compare those metrics to determine whether the workflow has improved.
Win rates and revenue should also be monitored, although changes cannot automatically be attributed to automation. Pricing, demand, seasonality, and competition influence commercial outcomes.
7. Common Hotel CRM Measurement Mistakes
Even comprehensive dashboards can produce misleading conclusions when metrics lack context.
Measuring activity instead of results: Hundreds of calls and emails demonstrate effort, not necessarily successful conversions.
Treating all inquiries equally: Poorly matched RFPs can distort conversion rates and make effective sales teams appear unsuccessful.
Failing to record lost-business reasons: Without accurate loss data, managers cannot distinguish pricing problems from availability constraints, slow responses, or poor property fit.
Misinterpreting website engagement: In Google Analytics 4, bounce rate represents the percentage of sessions that were not engaged. It is not simply the percentage of visitors who viewed one page and left.
Ignoring operational constraints: A delayed proposal may reflect missing information or fragmented systems rather than insufficient sales effort.
The solution is to interpret CRM data alongside the commercial processes producing it.
From Better CRM Reporting to Better Group Booking Revenue
Hotel CRM metrics should do more than describe sales activity. They should reveal how customer demand moves through the sales process and becomes revenue.
Engagement metrics identify potential opportunities. Conversion metrics show where those opportunities progress or stall. Retention and revenue metrics establish their long-term commercial value.
But identifying a bottleneck is only useful when hotels can address it.
If proposal turnaround is consistently slow, improving the dashboard will not solve the underlying problem. The hotel must examine how inquiries are processed, where property information is stored, and how much administrative work goes into each response.
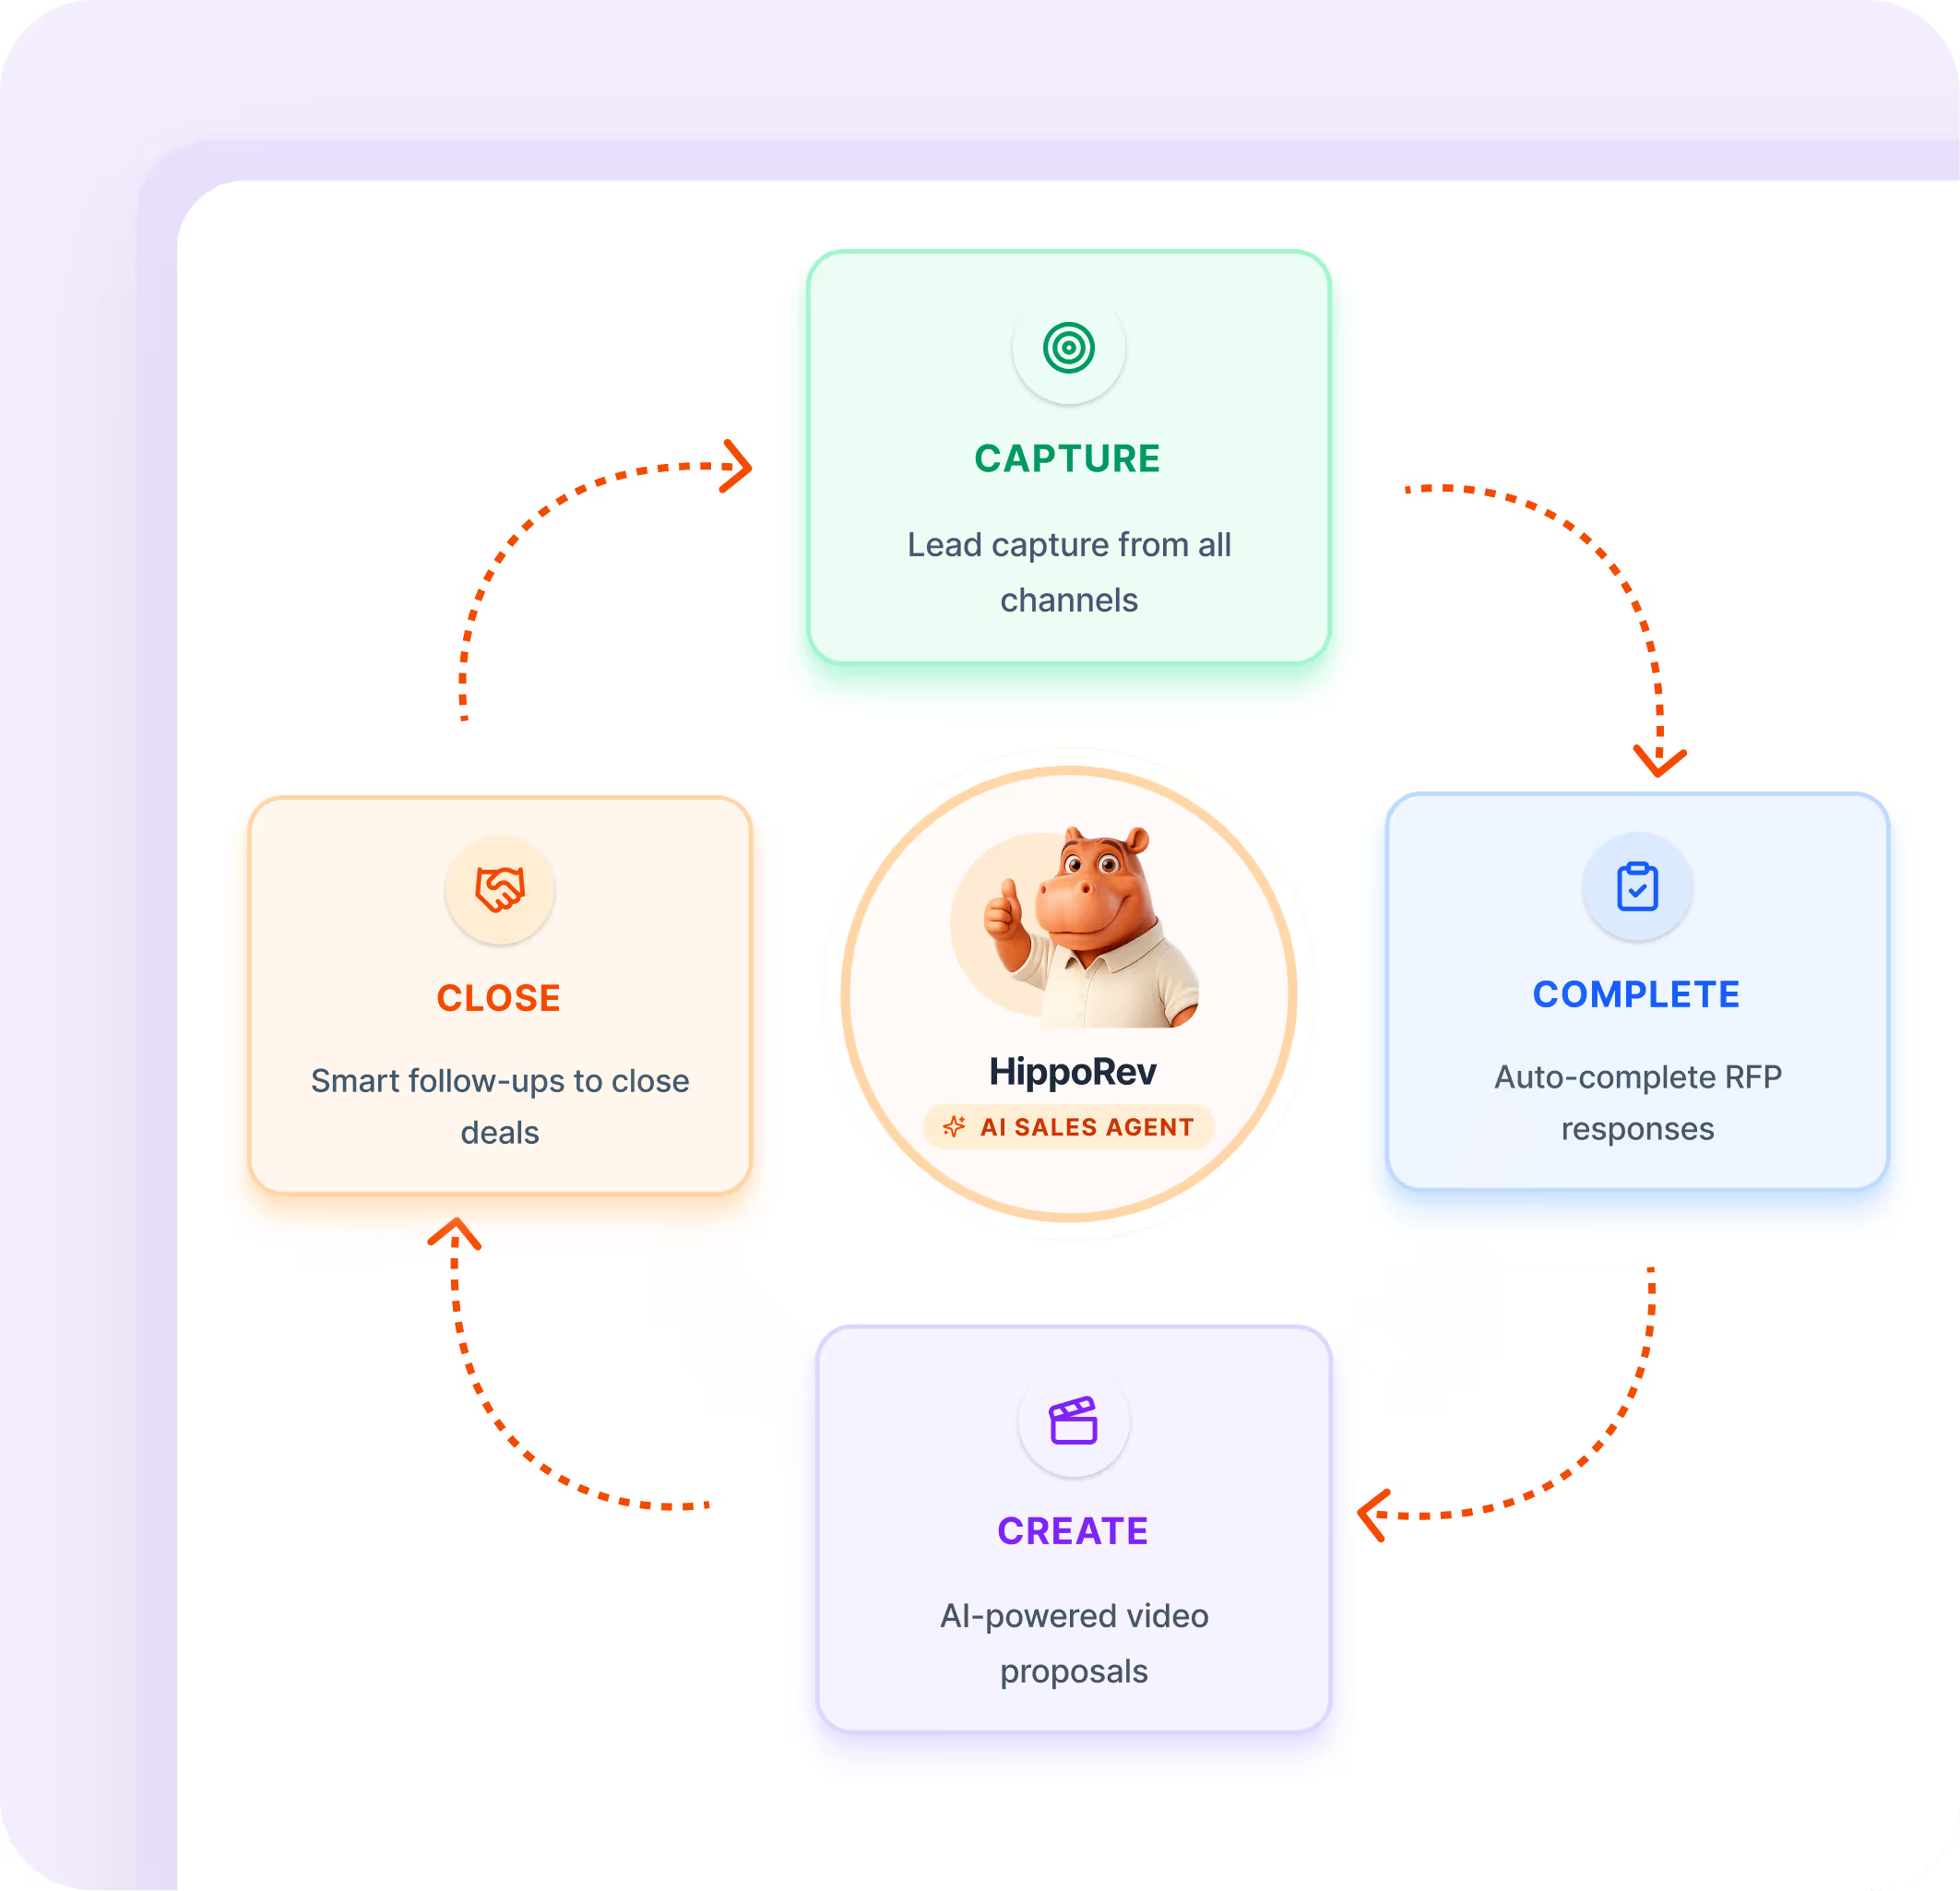
HippoRev helps hotel sales teams automate group sales workflows, including RFP and proposal preparation. By reducing repetitive administrative work, it gives sellers more time to focus on customer relationships and valuable opportunities.
Request a free HippoRev demo to explore how automation could improve your hotel's group sales process.
Frequently Asked Questions
What are the most important CRM KPIs for hotel sales teams?
Qualified inquiry volume, RFP response time, RFP conversion rate, proposal win rate, sales-cycle length, average booking value, and repeat account revenue provide a useful starting point.
How is a hotel CRM different from a PMS?
A CRM primarily manages customer relationships, account information, communications, and sales activity. A property management system (PMS) supports operations such as room inventory, reservations, guest stays, and billing.
Can hotel CRM automation increase bookings?
Automation can improve lead routing, response preparation, and follow-up. Whether it increases confirmed bookings depends on demand, pricing, availability, lead quality, and sales execution.
How often should hotels review CRM metrics?
Review response times and overdue inquiries daily, pipeline conversion and proposal performance weekly, and retention and revenue contribution monthly or quarterly.
What is the difference between RFP conversion rate and proposal win rate?
RFP conversion rate compares confirmed bookings with total RFPs received. Proposal win rate compares won proposals with proposals that have reached a decision. Together, they help identify where opportunities are being lost.
Share this post
Ready to close more group business?
See how HippoRev can transform your hotel sales workflow in 15 minutes.
Follow us


